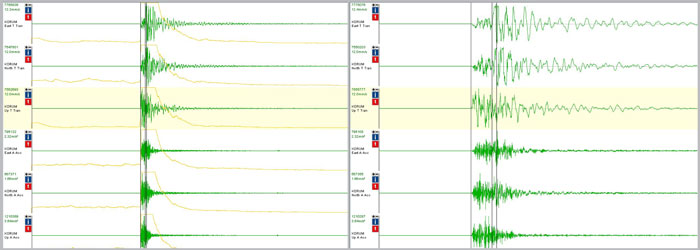
Above Left: Seismogram of closest site, Korumburra (KORUM), of the 2009-03-18 0528 UT, magnitude ML 4.7 Korumburra earthquake.
Above Right: Magnified view of Right Left
Melbourne Shakes ... The string of earthquakes on the outskirts of Melbourne.
Throughout 2009 the ES&S Seismology Research Centre has been involved in recording an extraordinary sequence of seismic activity near Korumburra, about 100 kilometres southeast of Melbourne.
Activity in this area began on the 4th of January with a small earthquake of magnitude ML 1.5. We now believe this was a precursory event for the magnitude ML 3.7 earthquake that occurred at Korumburra on the 12th of January at 7:48 pm local time. The estimated intensity at the epicentre was MMI 5.
This ML 3.7 was the first earthquake of the sequence to trigger the ES&S Alarm Notification Service. Clients were all contacted and notified of the estimated intensities at their relevant assets. Ten intensity reports were sent in to ES&S from residents in Korumburra and Leongatha. The mainshock was followed by a series of at least 8 aftershocks, the largest of which was a magnitude ML 2.0.
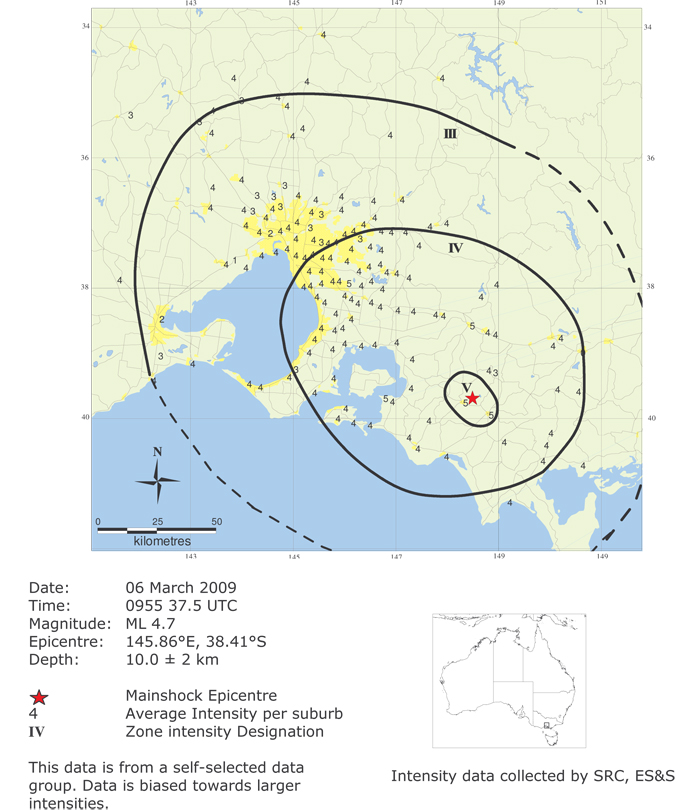
On March 6th at 8:55pm local time the first of two magnitude ML 4.7 earthquakes occurred 3.5 kilometres northeast of Korumburra. This earthquake produced severe shaking and an estimated intensity at the epicentre and up to 8 kilometres around of MMI 6.
This earthquake was quite strongly felt in Melbourne and over 1000 intensity reports were sent in from people throughout Victoria, up to 180 kilometres from Korumburra.
The closest site to Korumburra at that stage was 40 kilometres to the south, at Fish Creek, an non-funded legacy recorder operated by ES&S. Figure 2 is the seismogram recorded at Fish Creek of the March 6th ML 4.7 earthquake
Following the March 6th ML 4.7 earthquake there were more than 60 aftershocks, several of which recorded magnitudes greater than ML 3.0. During this time ES&S recognised the necessity for a new site to be installed to record further significant earthquakes, and aftershock data.
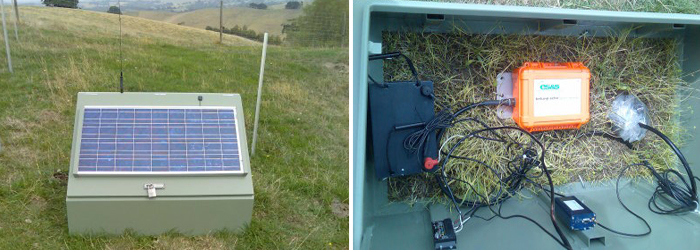
The Victorian Water Industry funded the installation of a new site, Korumburra (KORUM) which was positioned directly above the March 6th ML 4.7 epicentre. The installation took place on March 16th. A NextG telemetered six-channel Kelunji Echo was installed and will run for 12 months.
Data received from KORUM has constrained the depth of the Korumburra sequence earthquakes to approximately 8 kilometres. All earthquake locations calculated since the installation of KORUM have had improved precision and greatly reduced uncertainties.
Pictured below are some images of KORUM; located approximately 3.6 kilometres northeast of Korumburra.
Left: KORUM Site Housing
Right: KORUM six-channel Echo set up
On March 18th at 4:28 pm local time a third significant earthquake occurred northeast of Korumburra, with a magntiude of ML 4.7. The estimated intensity at the epicentre and up to 8 kilometres around was MMI 6.
This event triggered the Alarm Notification Service and again all relevant clients were contacted with estimated intensity information. Again, over 1000 intensity reports were sent in to ES&S, from people up to 180 kilometres from Korumburra.
This time the closest site to the earthquake was KORUM, almost directly above the epicentre. Figures 6&7 show the seismogram recorded at KORUM for the March 18th ML 4.7 Korumburra earthquake.
The top three channels show the ground velocity on the East, North and Vertical channels as recorded by the sensitive velocity seismometer. The bottom 3 channels show the ground acceleration as recorded on the strong motion accelerometer. The horizontal scale is seconds and all times are in UTC similar to GMT.
Shortly after the S wave arrival the top two horizontal channels are driven to full-scale (saturated by the signal) and so do not record the peak motion. This is exactly why we installed a six-channel instrument as the bottom three channels have easily coped with the strong motion and we have a full recording of the peak accelerations.
Peak Ground Acceleration recorded on the vertical channel is 0.36 g but less on the horizontal channels. This is at least partially due to the fact that the site is just about directly above the epicentre. As is expected from a relatively small earthquake the PGAs are quite high but the duration of strong motion is very short, at this distance most of the shaking is over in less than a few seconds. The S-P time of 0.92 seconds gives us a distance of around 8 kilometres from the instrument to the hypocentre. This essentially constrains the depth of the rupture. This recording is the closest high quality recording of an earthquake of this magnitude ever recorded in Australia.
Following the March 18th ML 4.7 earthquake there have now been more than 200 aftershocks, several of which recorded magnitudes greater than ML 3.0. Data from the intensity reports sent to in ES&S was used to create an isoseismal map, a contour map plotting the intensity of the earthquake as experienced in the varying suburbs across Gippsland and Greater Melbourne.
Below: Isoseismal Map of March 6th ML4.7 Korumburra Earthquake